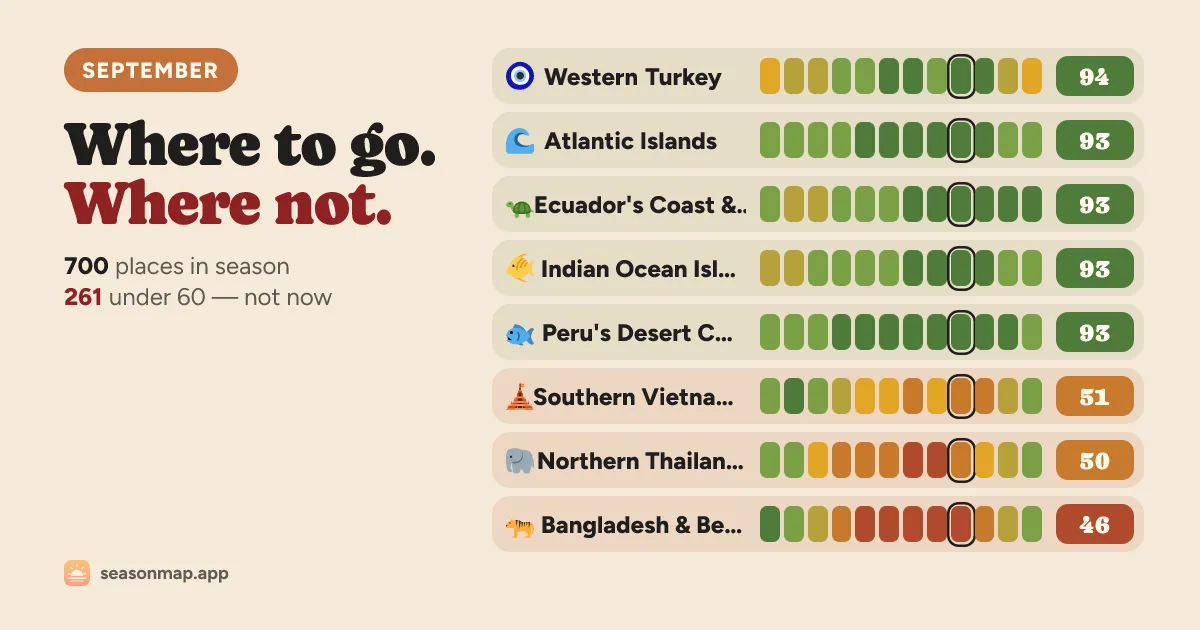
SeasonMap’s own September ranking card, color-coded across all twelve months.
SeasonMap’s real trick isn’t the 0–100 score. It’s that the site will show you exactly which weather station corrected which model estimate to produce it.
Every destination’s twelve monthly normals come from ten years of daily data, 2016–2025: ERA5 and ERA5-Land reanalysis from Copernicus/ECMWF, read through Open-Meteo, with air quality from the CAMS reanalysis. Reanalysis alone runs cool — checked against 1,011 real stations, it undershot daily highs by 1.6°C, 2.4°C on islands — so for roughly three destinations in four, SeasonMap corrects the model against a nearby NOAA station (GHCN-Daily, Global Summary of the Day), clamped so no single instrument can skew a region. Its own example: Yazd’s August high now reads 39.5°C, not reanalysis’s washed-out 35.9°C.
The score also isn’t one-size-fits-all. Pick beach, city walking, hiking, winter/snow, or running, and both the weights and the ideal temperature band shift, each anchored to published tourism-climate research — the Holiday Climate Index for cities, the Ski Climate Index for snow reliability, marathon-finisher physiology for running. Ask for February and Central Mexico tops out at 92/100 (dry season, 26°C highs) while the Andes ski towns fall to 15 (off-season, best June–September) — same month, opposite verdicts, because a beach town and a ski town are answering different questions.
Each place also lists what’s on, crowds, hazards, and cost — Tortuguero’s green turtle nesting cites conserveturtles.org, Cape Town’s flower season cites Wikipedia, not a generic “high season” shrug. Crowd flags admit they’re judgment calls: a “Peak crowds” month is labeled “the editor’s peak month for the place: full, expensive, and booked well ahead,” not a measured occupancy figure.
The map is free to browse for five minutes per device, capped at the top three places per group; a $7 trip pass, $29-a-year membership, or $69 lifetime unlock the rest, no account needed until you pay. It’s independent, unaffiliated with any government, airline, or weather agency.
The limitations page says the quiet part out loud: a ten-year normal isn’t a forecast, and a 24°C monthly average can hide an 18°C Tuesday and a 31°C Friday — a spread the score doesn’t capture. Places without a nearby station run on model data alone, and snow is flagged as the least reliable of the eight factors. Checked against Japan, where the seasons are common knowledge, the tool agrees: April, May and November score highest (75/100), July lowest (54) — cherry blossom and autumn color bracketing a hot, wet summer.