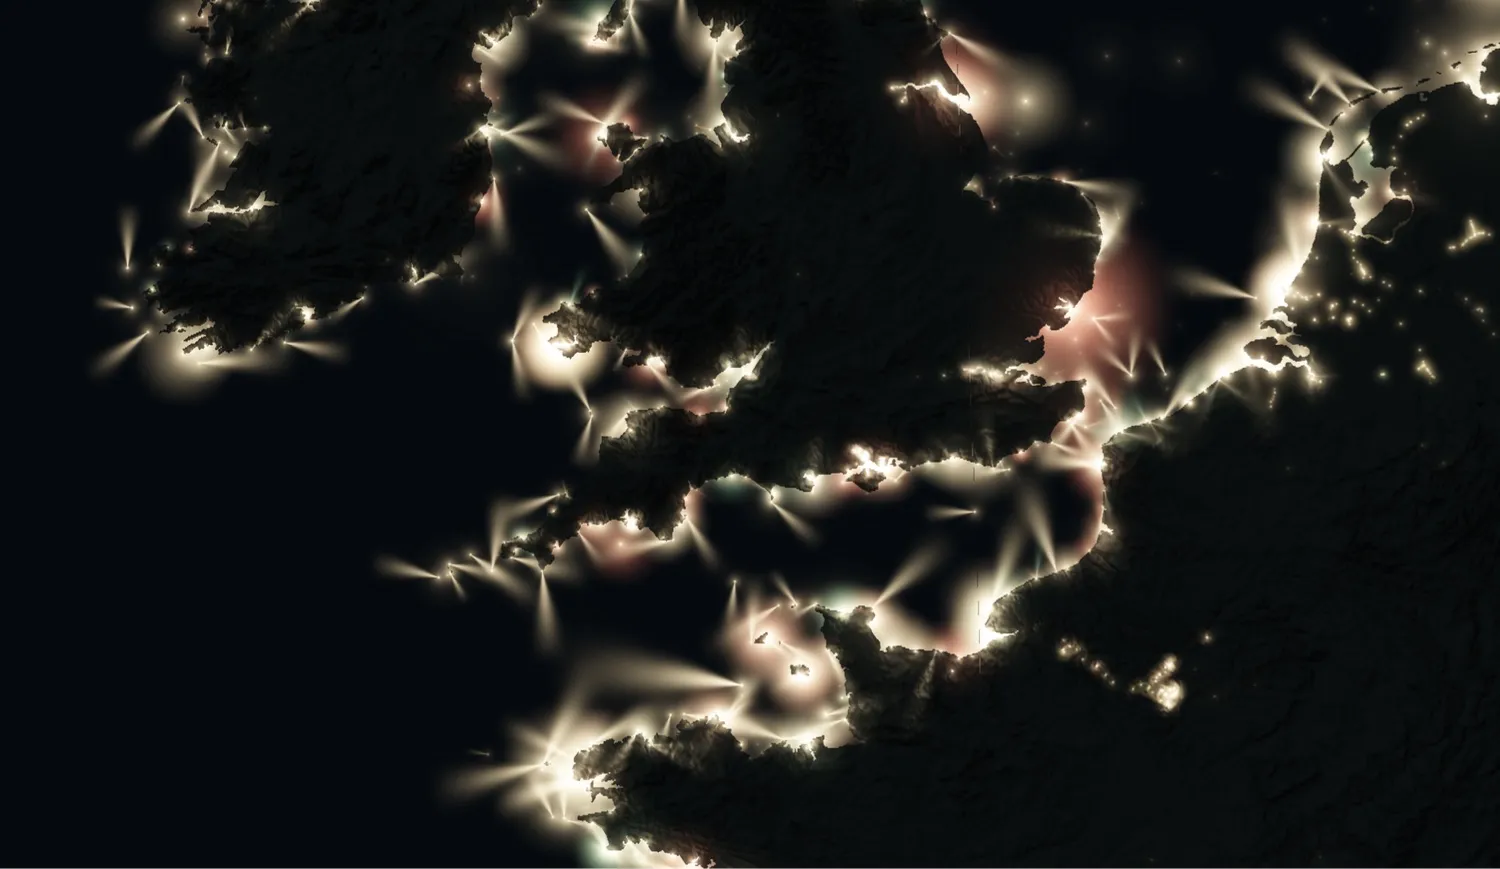
Screenshot: mapped.earth
Aaron Becker’s mapped.earth plots every charted navigational light on a night globe and makes each one flash on its published cycle. Zoom to a coast and the beams fan out over the water, at true scale.
On a chart, each lighthouse carries a short code: its character, the colour and rhythm of the light, and its period, the seconds before the pattern repeats. That is how a mariner can tell which tower they are looking at. The US Coast Guard’s Light List has a column for it, and warns navigators to check characteristics rather than guess from brightness.
Take the Outer Banks of North Carolina, where three neighbouring brick towers each have their own rhythm. In the 2023 Light List, Cape Hatteras shows one white flash every 7.5 seconds, Cape Lookout one every 15, and Bodie Island two flashes (2.5 seconds each, 2.5 apart) and then 22.5 seconds of dark, for a period of 30. A single light that blinks is a code, and three lights together form a vocabulary. mapped.earth plays tables like that back, light by light.
The site’s lights come from OpenSeaMap and OpenStreetMap contributors, each coast’s own List of Lights, NOAA charts and the Coast Guard list, with terrain from the Terrarium elevation model. The globe view shows landfall lights tracing coastlines from orbit. Descend and harbour lights appear, beams at scale, shadowed by the land they guard, as the site puts it. Presets jump to Scotland, Brittany, New England, Japan, Norway and Cape Town. The wider /lighthouses page has 29 separate coast maps, such as Scotland (188 lights) and Japan (263), where hovering a light gives its name, character and range. Jason Kottke, who posted it on 1 October, notes that “other charted lights like lighted buoys” are included.
Becker also makes the rest of mapped.earth: a live 3D wind and ocean-current globe, plus maps of lightning, rainfall, river flow and UV. He describes himself as a generalist who came from institutional asset allocation and builds tools with code. This map shows the habit: a table of values, turned into something you watch.
One limit: it is a visualization, not a navigation aid, and the data is only as complete as the volunteer and national sources behind it.