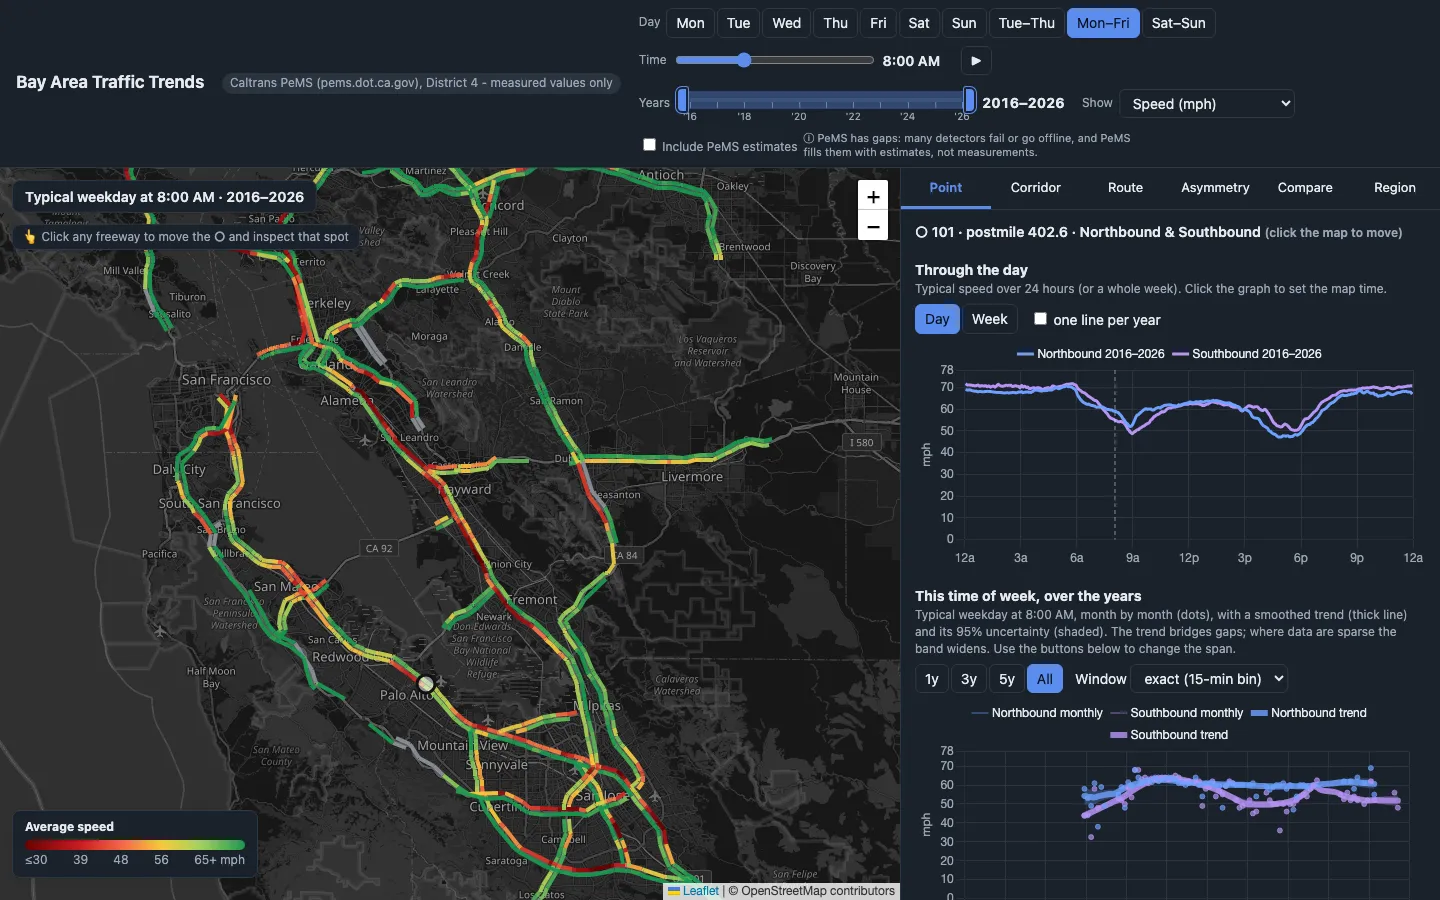
Ten years of Caltrans detector data (October 2016 to September 2026) turned into a map of typical speeds for any day, any five-minute slot and any span of years. Press play and watch the red spread through the morning. It can also show where queues form along a freeway and which spots have the most lopsided commutes. Gaps in the sensors are left out unless you opt into estimates.
Featured in: The dataset is the toy